
Stack trace support by Linux eBPF will make many new and awesome things possible, however, it didn’t make it into the just-released Linux 4.4, which added other eBPF features. Envisaging some time on older kernels that have eBPF but not stack tracing, I’ve developed a hacky workaround for doing awesome things now.
I’ll show my new bcc tools (eBPF front-end) that do this, then explain how it works.
stackcount: Frequency Counting Kernel Stack Traces
The stackcount tool frequency counts kernel stacks for a given function. This is performed in kernel for efficiency using an eBPF map. Only unique stacks and their counts are copied to user-level for printing.
For example, frequency counting kernel stack traces that led to submit_bio():
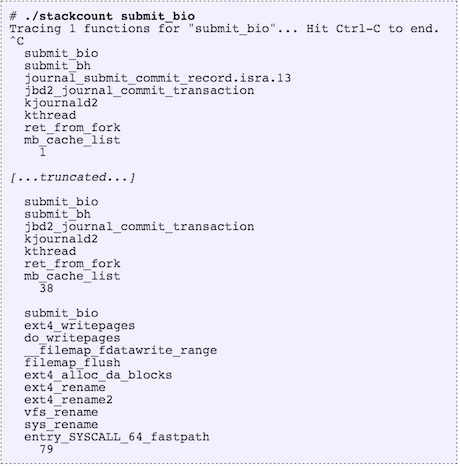
The order of printed stack traces is from least to most frequent. The most frequent in this example, printed last, was taken 79 times during tracing.
The last stack trace shows syscall handling, ext4_rename(), and filemap_flush(): looks like an application issued file rename has caused back end disk I/O due to ext4 block allocation and a filemap_flush().
This tool should be very useful for exploring and studying kernel behavior, quickly answering how a given function is being called.
stacksnoop: Printing Kernel Stack Traces
The stacksnoop tool prints kernel stack traces for each event. For example, for ext4_sync_fs():
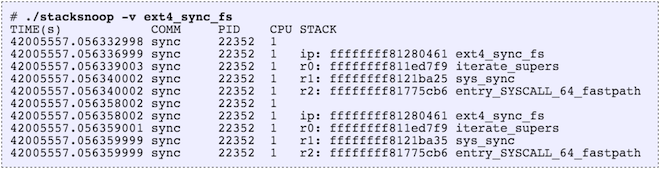
Since the output is verbose, this isn’t suitable for high frequency calls (eg, over 1,000 per second). You can use funccount from bcc tools to measure the rate of a function call, and if it is high, try stackcount instead.
How It Works: Crazy Stuff
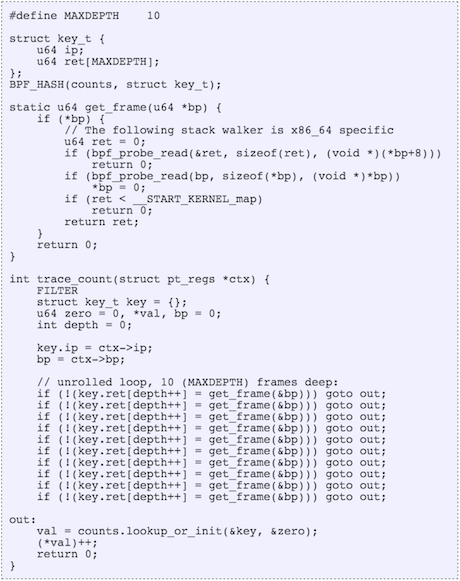
eBPF is an in-kernel virtual machine that can do all sorts of things, including “crazy stuff“. So I wrote a user-defined stack walker in eBPF, which the kernel can run. Here is the relevant code from stackcount (you are not expected to understand this):
Once eBPF supports this properly, much of the above code will become a single function call.
If you are curious: I’ve used an unrolled loop to walk each frame (eBPF doesn’t do backwards jumps), with a maximum of ten frames in this case. It walks the RBP register (base pointer) and saves the return instruction pointer for each frame into an array. I’ve had to use explicit bpf_probe_read()s to dereference pointers (bcc can automatically do this in some cases). I’ve also left the unrolled loop in the code (Python could have generated it) to keep it simple, and to help illustrate overhead.
This hack (so far) only works for x86_64, kernel-mode, and to a limited stack depth. If I (or you) really need more, keep hacking, although bear in mind that this is just a workaround until proper stack walking exists.
Other Solutions
stackcount implements an important new capability for the core Linux kernel: frequency counting stack traces. Just printing stack traces, like what stacksnoop does, has been possible for a long time: ftrace can do this, which I use in my kprobe tool from perf-tools. perf_events can also dump stack traces and has a reporting mode that will print unique paths and percentages (although it is performed less efficiently in user mode).
SystemTap has long had the capability to frequency count kernel- and user-mode stack traces, also in kernel for efficiency, although it is an add-on and not part of the mainline kernel.
Future Readers
If you’re on Linux 4.5 or later, then eBPF may officially support stack walking. To check, look for something like a BPF_FUNC_get_stack in bpf_func_id. Or check the latest source code to tools like stackcount – the tool should still exist, but the above stack walker hack may be replaced with a simple call.
Thanks to Brenden Blanco (PLUMgrid) for help with this hack. If you’re at SCaLE14x you can catch his IO Visor eBPF talk on Saturday, and my Broken Linux Performance Tools talk on Sunday!
**Used with permission from Brendan Gregg. (original post)**
—
About the author of this post
 Brendan Gregg
Brendan Gregg is a senior performance architect at Netflix, where he does large scale computer performance design, analysis, and tuning. He is the author of Systems Performance published by Prentice Hall, and received the USENIX LISA Award for Outstanding Achievement in System Administration. He has previously worked as a performance and kernel engineer, and has created performance analysis tools included in multiple operating systems, as well as visualizations and methodologies.