
Continuing from where I left before, in this post we would see some of the major changes in BPF that have happened recently – how it is evolving to be a very stable and accepted in-kernel VM and can probably be the next big thing – in not just filtering but going beyond. From what I observe, the most attractive feature of BPF is its ability to give access to the developers so that they can execute dynamically compiled code within the kernel – in a limited context, but still securely. This itself is a valuable asset.
As we have seen already, the use of BPF is not just limited to filtering out network packets but for seccomp, tracing etc. The eventual step for BPF in such a scenario was to evolve and come out of it’s use in the network filtering world. To improve the architecture and bytecode, lots of additions have been proposed. I started a bit late when I saw Alexei’s patches for kernel version 3.17-rcX. Perhaps, this was the relevant mail by Alexei that got me interested in the upcoming changes. So, here is a summary of what all major changes have occured. We will be seeing each of them in sufficient detail.
Architecture
The classic BPF we discussed in the last post had two 32 bit registers – A and X. All arithmetic operations were supported and performed using these two registers. The newer BPF called extended-BPF or eBPF has ten 64 bit registers and supports arbitary load/stores. It also contains new instructions like BPF_CALL which can be used to call some new kernel-side helper functions. We will look into this in detail a bit later as well. The new eBPF follows calling conventions which are more like modern machines (x86_64). Here is the mapping of the new eBPF registers to x86 registers:
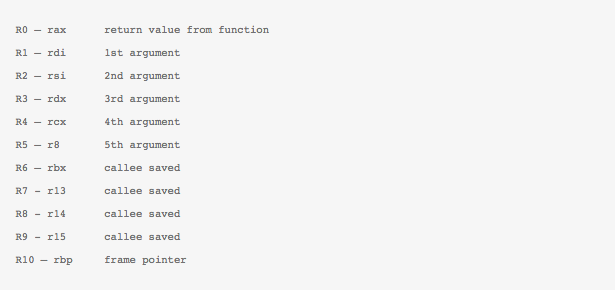
The closeness to the machine ABI also ensures that unnecessary register spilling/copying can be avoided. The R0 register stores the return from the eBPF program and the eBPF program contexts can be loaded through register R1. Earlier, there used to be just two jump targets i.e. either jump to TRUE or FALSE targets. Now, there can be arbitary jump targets – true or fall through. Another aspect of the eBPF instruction set is the ease of use with the in-kernel JIT compiler. eBPF Registers and most instructions are now mapped one-to-one. This makes emitting these eBPF instructions from any external compiler (in userspace) not such a daunting task. Of course, prior to any execution, the generated bytecode is passed through a verifier in the kernel to check its sanity. The verifier in itself is a very interesting and important piece of code and probably story for another day.
Building BPF Programs
From a users perspective, the new eBPF bytecode can now be another headache to generate. But fear not, an LLVM based backend now supports instructions being generated for BPF pseudo-machine type directly. It is being ‘graduated’ from just being an experimental backend and can hit the shelf anytime soon. In the meantime, you can always use this script to setup the BPF supported LLVM yourslef. But, then what next? So, a BPF program (not necessarily just a filter anymore) can be done in two parts – A kernel part (the BPF bytecode which will get loaded in the kernel) and the userspace part (which may, if needed gather data from the kernel part) Currently you can specify a eBPF program in a restricted C like language. For example, here is a program in the restricted C which returns true if the first argument of the input program context is 42. Nothing fancy :
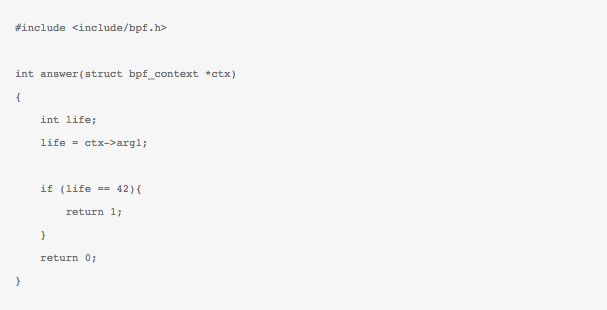
This C like syntax generates a BPF binary which can then be loaded in the kernel. Here is what it looks like in BPF ‘assembly’ representation as generated by the LLVM backed (supplied with 3.4) :
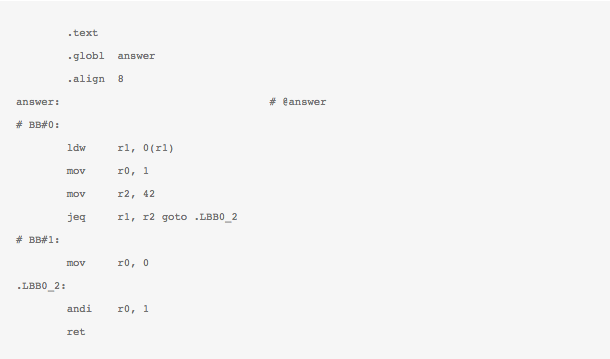
If you are adventerous enough, you can also probably write complete and valid BPF programs in assembly in a single go – right from your userspace program. I do not know if this is of any use these days. I have done this sometime back for a moderately elaborate trace filtering program though. It is also not effective as well, becasue I think at this point in human history, LLVM can generate assembly better and more efficiently than a human.
What we discussed just now is probably not a relevant program anymore. An example by Alexei here is what is more relevant these days. With the integration of Kprobe with BPF, a BPF program can be run at any valid dynamically instrumentable function in the kernel. So now, we can probably just use pt_regs as the context and get individual register values at each time the probe is hit. As of now, some helper functions are available in BPF as well, which can get the current timestamp. You can have a very cheap tracing tool right there ![]() 🙂
🙂
BPF Maps
I think one of the most interesting features in this new eBPF is the BPF maps. It looks like an abstract data type – initially a hash-table, but from kernel 3.19 onwards, support for array-maps seems to have been added as well. These bpf_maps can be used to store data generated from a eBPF program being executed. You can see the implementation details in arraymap.c or hashtab.c Lets pause for a while and see some more magic added in eBPF – esp. the BPF syscall which forms the primary interface for the user to interact and use eBPF. The reason we want to know more about this syscall is to know how to work with these cool BPF maps.
BPF Syscall
Another nice thing about eBPF is a new syscall being added to make life easier while dealing with BPF programs. In an article last year on LWN Jonathan Corbet discussed the use of BPF syscall. For example, to load a BPF program you could call

with of course, the corresponding bpf_attr structure being filled before :
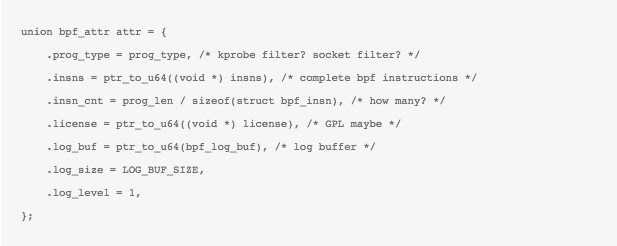
Yes, this may seem cumbersome to some, so for now, there are some wrapper functions inbpf_load.c and libbpf.c released to help folks out where you may need not give too many details about your compiled bpf program. Much of what happens in the BPF syscall is determined by the arguments supported here. To elaborate more, let’s see how to load the BPF program we did before. Assuming that we have the sample program in its BPF bytecode form generated and now we want to load it up, we take the help of the wrapper function load_bpf_file() which parses the BPF ELF file and extracts the BPF bytecode from the relevant section. It also iterates over all ELF sections to get licence info, map info etc. Eventually, as per the type of BPF program – Kprobre/kretprobe or socket program, and the info and bytecode just gathered from the ELF parsing, the bpf_attr attribute structure is filled and actual syscall is made.
Creating and accessing BPF maps
Coming back to the maps, apart from this simple syscall to load the BPF program, there are many more actions that can be taken based on just the arguments. Have a look at bpf/syscall.c From the userspace side the new BPF syscall comes to the rescue and allows most of these operations on bpf_maps to be performed! From the kernel side however, with some special helper function and the use of BPF_CALL instruction, the values in these maps can be updated/deleted/accessed etc. These helpers inturn call the actual function according to the type of map – hash-map or an array. For example, here is a BPF program that just creates an array-map and does nothing else,
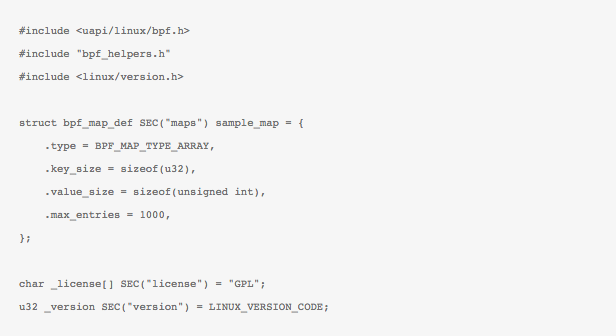
When loaded in the kernel, the array-map is created. Form the userspace we can then probably initialize the map with some values with a function that look likes this,

where bpf_update_elem() wrapper is in-turn calling the BPF syscall with proper arguments and attributes as,

This inturn calls map_update_elem() which securely copies the key and value using copy_from_user() and then calls the specialized function for updating the value for array-map at the specified index. Similar things happen for reading/deleting/creating has or array maps from userspace.
So probably, things will start falling into pieces now from the earlier post by Brendan Gregg where he was updating a map from the BPF program (using the BPF CALL instruction which calls the internal kernel helpers) and then concurrently accessing it from userspace to generate a beautiful histogram (through the syscall I just mentioned above). BPF Maps are indeed a very powerful addition to the system. You can also checkout more detailed and complete examplesnow that you know what is going on. To summarize, this is how an example BPF program written in restricted C for kernel part and normal C for userspace part would run these days:
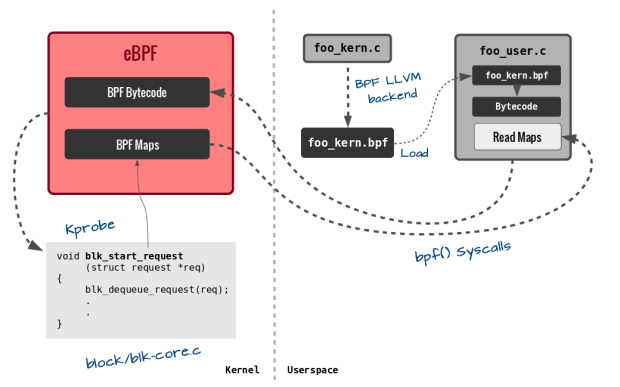
In the next BPF post, I will discuss the eBPF verifier in detail. This is the most crucial part of BPF and deserves detailed attention I think. There is also something cool happening these days on the Plumgrid side I think – the BPF Compiler Collection. There was a very interesting demo using such tools and the power of eBPF at the recent Red Hat Summit. I got BCC working and tried out some examples with probes – where I could easily compile and load BPF programs from my Python scripts! How cool is that ![]() Also, I have been digging through the LTTng’s interpreter lately so probably another post detailing how the BPF and LTTng’s interpreters work would be nice to know. That’s all for now. Run BPF.
Also, I have been digging through the LTTng’s interpreter lately so probably another post detailing how the BPF and LTTng’s interpreters work would be nice to know. That’s all for now. Run BPF.
—
About the author of this post
 Suchakra Sharma